Hey there! If you’re looking to automate your weekly sales reporting by generating dashboards in Google Sheets, you’re in the right place. In this guide, I’ll walk you through setting up an automated workflow using Make (formerly Integromat), Shopify, Google Sheets, and Formatter modules. By the end, you’ll have a system that pulls last week’s orders and revenue into a single, easy-to-read sheet. Let’s dive in!
Introduction
Manually compiling sales data every week can be a time-consuming task. Automating this process not only saves time but also reduces the risk of errors. With Make, you can create a seamless workflow that fetches data from Shopify and populates a Google Sheet with your weekly sales metrics. This setup is perfect for solo entrepreneurs or small teams looking to streamline their reporting processes.
Step-by-Step Guide
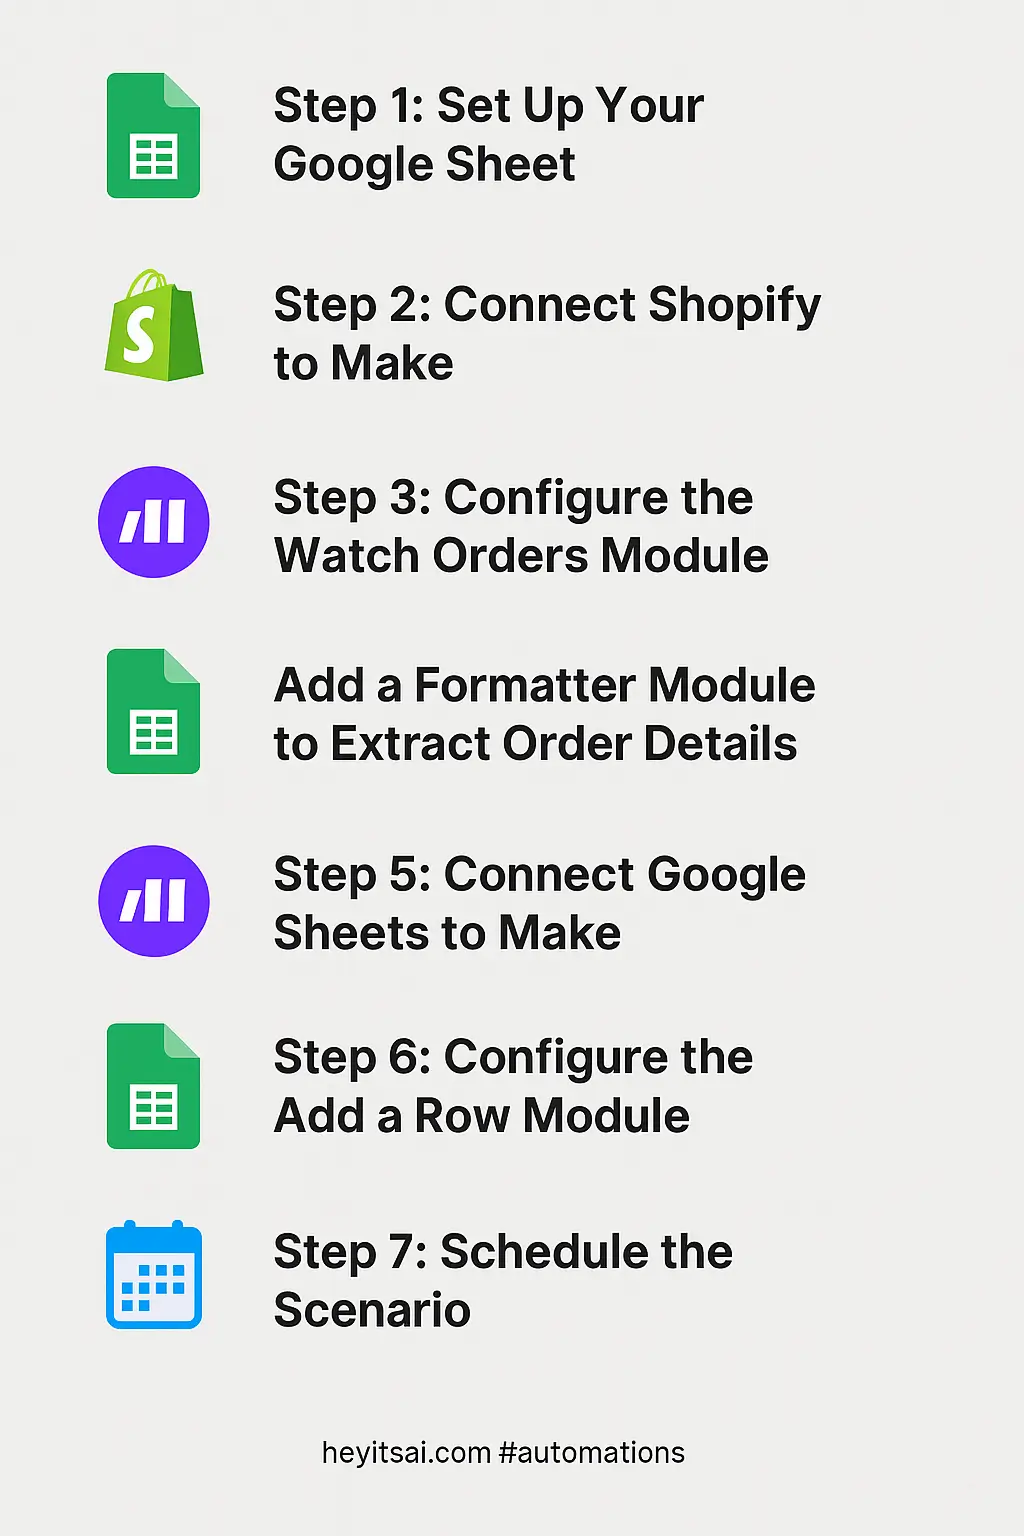
Step 1: Set Up Your Google Sheet
First, create a new Google Sheet that will serve as your sales dashboard. Here’s how:
- Open Google Sheets and create a new spreadsheet.
- Rename the sheet to something like “Weekly Sales Dashboard.”
- In the first row, add the following column headers:
- Date
- Order ID
- Customer Name
- Total Amount
- Order Status
These columns will help you track essential details about each order.
Step 2: Connect Shopify to Make
Next, you’ll need to connect your Shopify store to Make:
- Log in to your Make account.
- Click on “Create a new scenario.”
- In the scenario editor, click the “+” button to add a new module.
- Search for “Shopify” and select the “Watch Orders” module.
- Click “Add” to create a new connection and follow the prompts to authorize Make to access your Shopify store.
Once connected, this module will monitor your Shopify store for new orders.
Step 3: Configure the Watch Orders Module
Now, let’s set up the “Watch Orders” module to fetch orders from the past week:
- In the module settings, set the “Status” field to “any” to include all orders.
- Set the “Financial Status” to “paid” to focus on completed transactions.
- In the “Created At Min” field, enter the following formula to fetch orders from the past week:
formatDate(addDays(now; -7); "YYYY-MM-DDTHH:mm:ssZ")
- Leave the “Created At Max” field empty to include all orders up to the current date.
This configuration ensures that the module retrieves all paid orders from the past seven days.
Step 4: Add a Formatter Module to Extract Order Details
To extract and format the order details, add a Formatter module:
- Click the “+” button after the Shopify module and select “Tools” > “Set Variable.”
- Name the variable “OrderDetails.”
- In the “Value” field, enter the following JSON structure:
{"Date": "{{created_at}}", "Order ID": "{{id}}", "Customer Name": "{{customer.first_name}} {{customer.last_name}}", "Total Amount": "{{total_price}}", "Order Status": "{{financial_status}}"}
This step formats the order data into a structured format for easy mapping.
Step 5: Connect Google Sheets to Make
Now, let’s link your Google Sheet to Make:
- Click the “+” button after the Formatter module and search for “Google Sheets.”
- Select the “Add a Row” module.
- Click “Add” to create a new connection and follow the prompts to authorize Make to access your Google Sheets.
With this connection, Make can now add data directly to your spreadsheet.
Step 6: Configure the Add a Row Module
Set up the “Add a Row” module to insert the formatted order details into your Google Sheet:
- Select the spreadsheet you created earlier.
- Choose the appropriate worksheet (e.g., “Sheet1”).
- In the “Values” section, map each column to the corresponding data from the Formatter module:
- Date:
{{OrderDetails.Date}} - Order ID:
{{OrderDetails.Order ID}} - Customer Name:
{{OrderDetails.Customer Name}} - Total Amount:
{{OrderDetails.Total Amount}} - Order Status:
{{OrderDetails.Order Status}}
- Date:
This mapping ensures that each piece of data is placed in the correct column.
Step 7: Schedule the Scenario
To automate this process weekly:
- Click on the clock icon in the scenario editor to set up scheduling.
- Choose “Weekly” and select the day and time you want the scenario to run (e.g., every Monday at 8 AM).
- Save the schedule.
Now, your scenario will run automatically every week, pulling the latest sales data into your Google Sheet.
Optional Enhancements
Want to take your dashboard to the next level? Here are a few quick-win ideas:
- Calculate Weekly Totals: Add a row at the top of your sheet that sums up the total sales and number of orders for the week.
- Visualize Data: Use Google Sheets’ built-in chart tools to create graphs that visualize your weekly sales trends.
- Send Email Reports: Add an email module in Make to send the updated spreadsheet to your inbox every week.
By following these steps, you’ll have a fully automated system that keeps your sales data organized and up-to-date, allowing you to focus more on growing your business and less on manual reporting. Happy automating!